Ultra-processed food: what your food photos reveal about your diet
NOVA classification research shows ultra-processed foods drive overconsumption. Your meal photos may tell the story better than calorie counts.
arrow_back All articles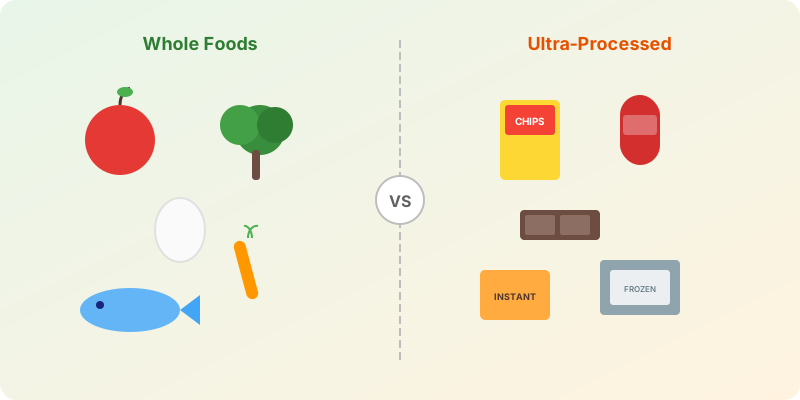
Calorie counting treats all calories equally. But a growing body of research suggests that where your calories come from matters as much as how many you consume.
The NOVA classification
The NOVA system, developed by researchers at the University of São Paulo, classifies foods into four groups based on processing level:
- Unprocessed/minimally processed — fruits, vegetables, eggs, meat, fish
- Processed culinary ingredients — oils, butter, sugar, salt
- Processed foods — canned vegetables, cheese, bread
- Ultra-processed foods (UPF) — soft drinks, chips, instant noodles, packaged snacks, reconstituted meats
The distinction isn't about "good" or "bad." It's about what happens to eating behavior when UPF dominates.
What the research shows
A landmark 2019 NIH study by Kevin Hall put participants on either an ultra-processed or unprocessed diet for two weeks, then switched. Both diets were matched for calories, sugar, fat, fiber, and macros. The results:
- On the ultra-processed diet, people ate ~500 more calories per day — entirely voluntarily
- They gained ~1 kg in two weeks; on unprocessed food, they lost ~1 kg
- Eating speed was faster on UPF — suggesting reduced satiety signaling
A 2024 umbrella review of 45 meta-analyses linked high UPF consumption to increased risk of cardiovascular disease, type 2 diabetes, depression, and all-cause mortality (Lane et al., 2024).
What your food photos show
You don't need to classify every food item. Simply scrolling through a week of meal photos reveals the pattern visually:
- Lots of packaging visible? — high UPF ratio
- Colors mostly brown and beige? — limited whole food variety
- Recognizable ingredients? — if you can identify what's on the plate, it's likely less processed
- Meals vs. snacks ratio — UPF tends to cluster in snacking, not structured meals
The photo advantage over databases
Traditional food databases don't track processing level. You can log "chicken nuggets" and get accurate calories — but the database won't flag that they're a reconstituted UPF product vs. home-breaded chicken breast.
Photos capture context: packaging, preparation method, and meal composition. Over time, your photo log becomes a visual food diary that shows processing patterns no calorie number can convey.
Practical steps
- Scroll your weekly photos — look for the ratio of whole foods to packaged items
- One swap per week — replace one UPF-heavy meal with a whole-food alternative
- Don't eliminate, reduce — UPF isn't poison. The goal is shifting the ratio, not perfection
- Cook one more meal — home-cooked meals are almost always less processed than bought ones
How NutritionCam helps
- Visual food diary — scroll through meals and spot the pattern without counting
- No judgment — the app estimates nutrition, it doesn't label foods as "bad"
- Weekly trends — macro patterns shift naturally when UPF decreases (more fiber, more protein, less sodium)
Your food photos are a mirror. They show what you eat more honestly than any number — and that awareness alone drives better choices.
References
- Hall, K. D. et al. (2019). Ultra-Processed Diets Cause Excess Calorie Intake and Weight Gain. Cell Metabolism, 30(1), 67–77. doi:10.1016/j.cmet.2019.05.008
- Lane, M. M. et al. (2024). Ultra-processed food exposure and adverse health outcomes. BMJ, 384, e077310. doi:10.1136/bmj-2023-077310